4. Cash Flow Reports
- apavel6
- Jan 20, 2024
- 4 min read
Updated: May 12, 2025
Revenue by Project
This report displays the total amount of revenue for a specified date range including the breakup of each project that contributes to the overall total. Depending on the dates selected, the report will have some months as actual revenue and other months as forecast revenue, and depending on the accounting system integration, the data may display earned revenue rather than invoiced revenue. Each filter on the report header is sortable along with the role and resource selected. This report also includes a cumulative revenue and a revenue by period graph.

The information below describes each number based field and where in UniPhi data is populated:
Pipeline - forecasted amount from the revenue module , anticipated but not yet committed.
Comitted - An amount assigned to a specific cost code in the Contracts module.
Total - Pipeline + Commited
Budget -The Budget line from the Revenue Module which follows a coded structure with phased amounts.
Variance - Difference between the Budget and the Total
Project Contract Details
This report shows deliverables and variations of contracts, grouped by project and financial period.

The information below describes each number based field and where in UniPhi data is populated:
Contract Total – The total value of contract deliverables, including variations.
Phased Total – The portion of the total contract amount that has been allocated across the schedule section of the Contracts Module.
Variance – The difference between the Contract Total and the Phased Total.
Project Cashflow Export
This report displays project costs broken down by period and cost code

Act – The total actuals recorded as of a specific date in the Cost Module for the designated cost code.
Fct – The forecasted amount for a specific date in the Cost Module for the designated cost code.
Budget – The total budgeted amount recorded in the Cost Module, structured according to the coded framework established in the chart of accounts.
Project Cash Flow
This report displays project costs broken down by period and cost code.
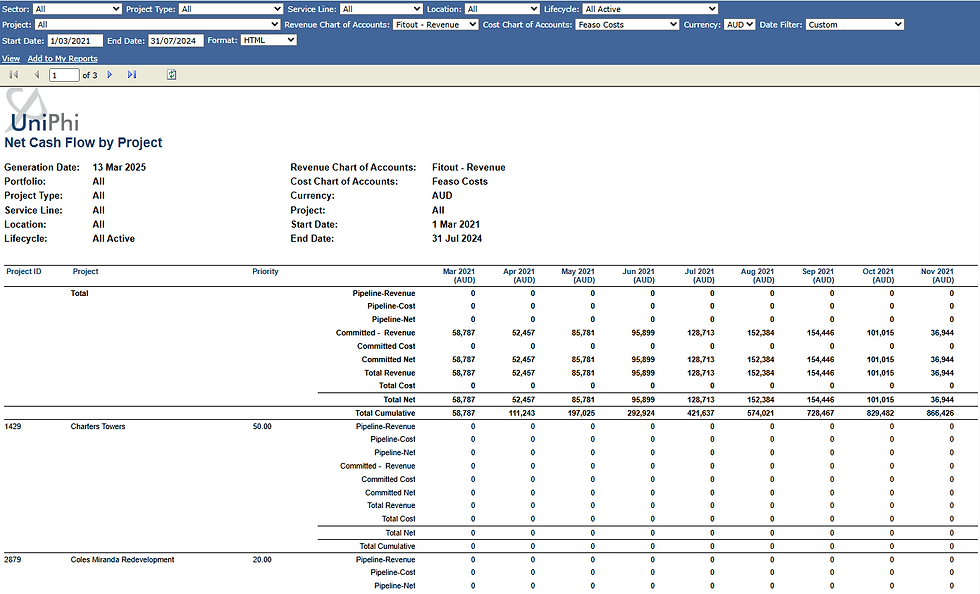
Net Cash Flow By Project
This report compares pipeline and committed revenues to costs, grouped by project and financial period. Including a total net cash flow for each project.

The information below describes each number based field and where in UniPhi data is populated:
Pipeline Revenue - Expected revenue from future contracts or work that is yet to be invoiced.
Pipeline Cost - Estimated costs associated with upcoming work that has not yet been incurred.
Pipeline Net - Difference between Pipeline Revenue and Pipleine Cost
Committed Cost - Revenue that has been secured through signed contracts or confirmed agreements.
Comitted Net - Difference between Comiited Revenue and Comitted Cost
Total Revenue - The sum of committed and pipeline revenue, representing total potential income.
Total Cost - The sum of committed and pipeline costs, representing the overall financial obligations.
Net Cash Flow by Code
This report displays actual and forecast cost, revenue and net cash flow grouped by financial period. Including a total net cash flow and cumulative net cash flow.

Cash Flow Export
Export actual, forecast or budget values in a format which can be imported into the Manual Phasing screen in the Cost or Revenue tab.

Cash Flow By Project and By Period
This report analyses forecasted cash flow against the budget, organised by project. It provides insights into financial performance over time, helping to track variances and assess alignment with planned expenditures. For accurate results, this report requires that all relevant costs be recorded in the Costs Module, including resource costs or estimated project cost/benefit differentials.
Cash Flow by Period
The cash flow by period report is looking at internal revenue and internal cost codes to calculate a bottom line free cash flow. This report will only work if resource costs have been added to the costs module or if you are estimating the cost/benefit differential of a project and have included all costs in the Costs module.

The information below describes each number based field and where in UniPhi data is populated:
Act/Fcst – The total actuals and forecasted amounts that have been time-phased on a monthly basis within the Revenue Module for the designated chart of accounts.
Budget – The total budgeted amount recorded in the Revenue Module, structured according to the coded framework established in the chart of accounts, and time-phased accordingly.
Variance – The difference between the Act/Fcst and the Budget.
Cash Flow by Year
This report is the same as the previous report but grouped year by year instead of month by month. Each project is expandable to show detailed cost against the chart of account specified.

The information below describes each number based field and where in UniPhi data is populated:
Act/Fcst – The total actuals and forecast recorded for that financial year in the Cost Module for the designated chart of accounts
Budget – The total budgeted amount recorded in the Cost Module, structured according to the coded framework established in the chart of accounts for that financial year.
Variance – The difference between the Act/Fcst and the Budget


Comments